
Business Intelligence and Data Visualization Tools: What to Use and Why
 Vladimiros Mykogian3 Αυγούστου 2026
The best business intelligence and data visualization tools turn raw data into decisions your team can act on today. In 2026, the gap between companies that use BI well and those that don't is measured in revenue, speed, and competitive position. If you're a startup founder or product leader trying to figure out which tools belong in your stack, this guide gives you a clear, opinionated answer.
Why BI and Data Visualization Actually Matter for Growing Companies
Most early-stage companies drown in data while starving for insight. They have analytics platforms, a CRM, a payment processor, and a database, but no single place where those signals connect into a coherent picture.
A proper BI setup solves exactly that problem. It pulls data from multiple sources, models it into something consistent, and surfaces it visually so decision-makers don't need to run SQL queries every time they want to understand churn or conversion. The practical result: faster decisions, fewer gut-feel mistakes, and a shared language across product, sales, and finance.
For startups scaling from 10 to 100 employees, this is the inflection point where "winging it with spreadsheets" stops working.
The Core Categories of Business Intelligence and Data Visualization Tools
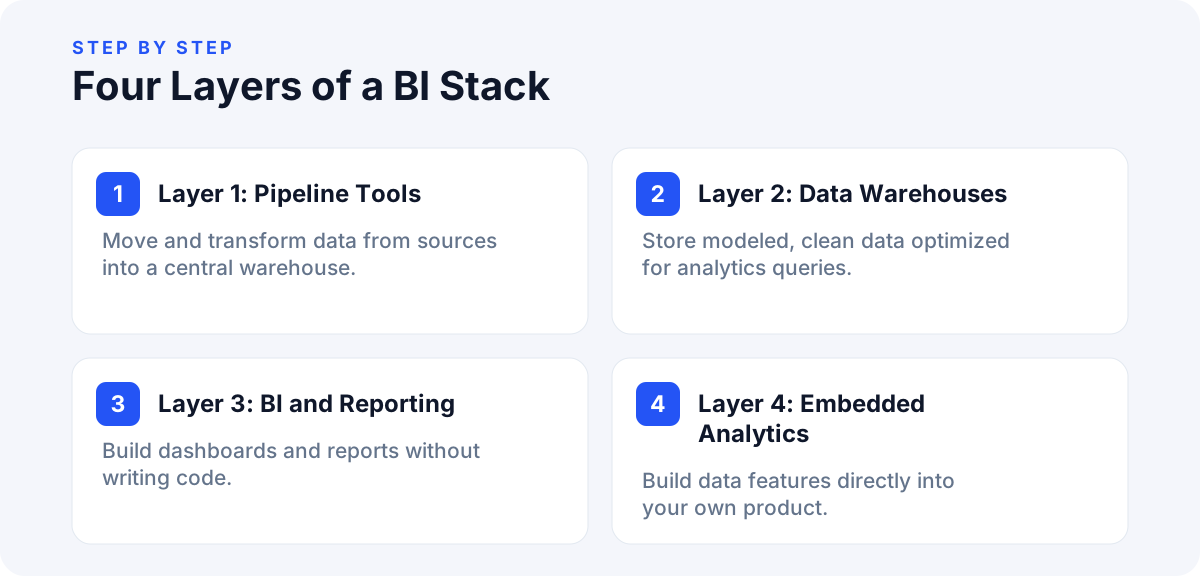
Understanding the landscape before picking a tool saves you months of wasted effort. There are four distinct layers:
- Data integration and pipeline tools: move and transform data from sources into a central warehouse (ETL or ELT processes).
- Data warehouses: store your modeled, clean data at scale (columnar databases optimized for analytics queries).
- BI and reporting layers: connect to the warehouse and let teams build dashboards, reports, and ad-hoc queries without writing code.
- Embedded analytics and data visualization libraries: for teams building data features directly into their own products.
Most companies need at least layers three and four. Fast-growing companies with multiple data sources need all four.
For a solid grounding in how these layers fit together, the DAMA Data Management Body of Knowledge is a useful reference for teams formalizing their data practices.
Choosing the Right BI Tool: A Practical Framework
Rather than listing every tool in existence, here is the decision framework that actually matters:
Who will use the dashboards?
If your primary users are non-technical business stakeholders, you need a tool with a drag-and-drop interface, clean default charts, and row-level security so sales reps only see their own numbers. If your users are analysts or engineers, a more code-friendly environment with version control and custom SQL support will be far more productive.
How complex is your data model?
A simple SaaS product with one database and under a million rows per table can get away with a lightweight BI connector pointed directly at a Postgres replica. A marketplace or multi-product business with events data, financial data, and CRM data needs a proper warehouse and a semantic layer sitting in front of the BI tool.
Do you need to embed analytics in your product?
If you're building a SaaS platform and want to show your own customers their own data inside your app, you need an embeddable solution, not a standalone BI tool. This is a fundamentally different use case and requires a different category of tooling.
What is your team's current data maturity?
Be honest here. Buying an enterprise-grade BI platform when your team has no data engineer is a fast way to spend budget on a tool nobody uses. Match the tool's complexity to your team's actual capacity.
What to Look For in Business Intelligence and Data Visualization Tools in 2026
Rather than naming specific vendors (the market shifts constantly), focus on the capabilities that should be non-negotiable right now:
For business dashboards and self-serve reporting
Look for: natural language query support, AI-generated chart suggestions, Git-based version control for your data models, and a semantic layer that lets you define metrics once and reuse them everywhere. The shift toward AI-assisted BI means non-technical users can now ask questions in plain English and get a valid chart in seconds. If your chosen tool doesn't support this in 2026, you're already behind.
For data visualization inside your own product
Look for: a well-maintained JavaScript charting library compatible with your frontend framework (React, Vue, or Angular), WebSocket support for real-time data, and accessibility compliance out of the box. A small SaaS team might build a customer-facing analytics dashboard using a headless charting library on the frontend backed by a fast API endpoint, rather than embedding a full BI tool. This keeps the product feel consistent and avoids third-party branding bleeding into your UI.
For the data pipeline and warehouse layer
Look for: column-level lineage tracking, incremental data loading to keep costs down, and dbt compatibility for transformation logic. Cloud-native warehouses with pay-per-query pricing are now accessible even to seed-stage startups.
Common Mistakes That Undermine BI Projects
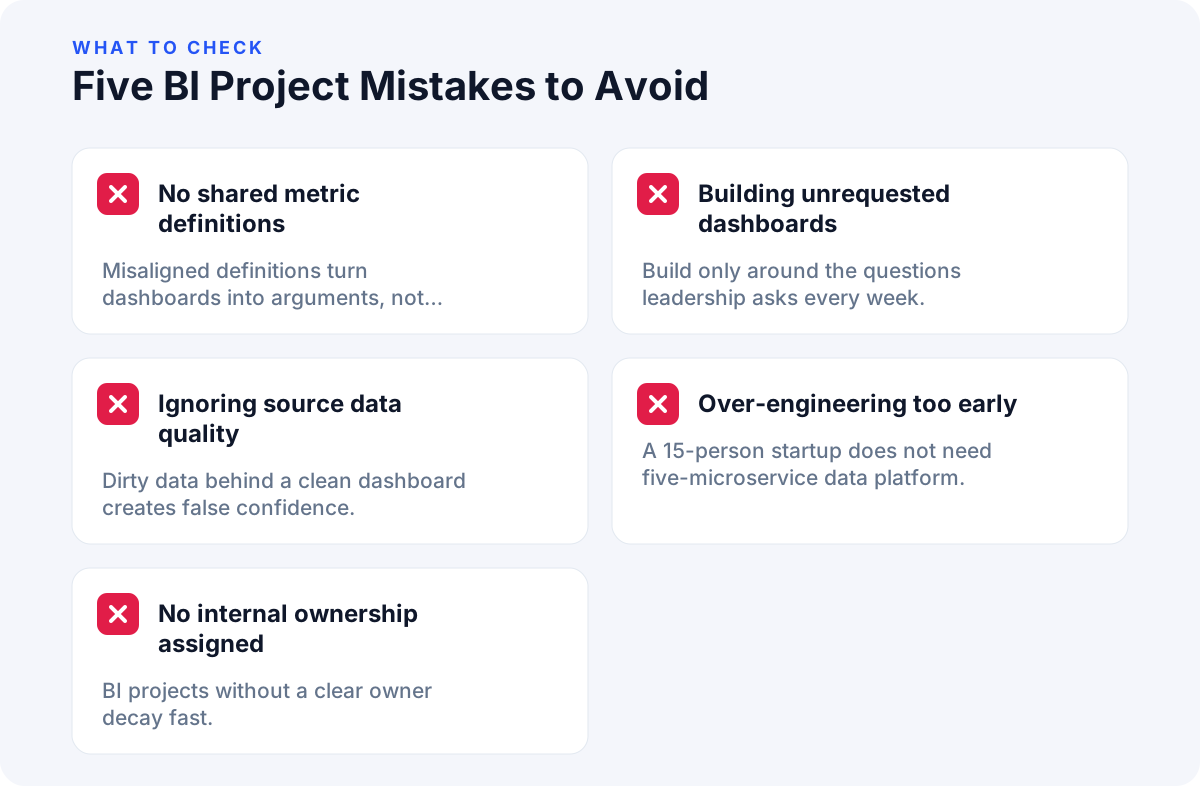
Getting the tool right is only half the battle. These are the mistakes that kill BI initiatives regardless of budget:
- No single source of truth for metric definitions. When sales defines "monthly revenue" differently from finance, dashboards create arguments instead of alignment. Define your metrics formally, in one place, before you build a single chart.
- Building dashboards nobody asked for. Start with three to five questions your leadership team asks every week. Build dashboards that answer exactly those questions. Everything else is secondary.
- Ignoring data quality at the source. A beautiful dashboard built on dirty data is worse than no dashboard because it creates false confidence. Invest in data validation at the ingestion layer before you invest in visualization.
- Over-engineering the stack too early. A 15-person startup does not need a Kubernetes-orchestrated data platform with five microservices. A well-configured cloud warehouse and a mid-tier BI tool will serve you until you have a dedicated data team.
- No ownership. BI projects without a clear internal owner decay fast. Assign someone, even part-time, who is responsible for data quality and dashboard maintenance.
Embedding Analytics Into Your Product: A Special Case
If you're building a SaaS product that serves business customers, embedded analytics is quickly becoming a table-stakes feature rather than a nice-to-have. Your customers want to see their own data inside your product, not export CSVs and analyze them elsewhere.
The architectural decision here is important: you can use a dedicated embedded analytics platform, or you can build a custom visualization layer using open-source charting libraries. The custom build gives you full design control and avoids per-seat pricing that scales painfully as your customer base grows. The platform approach is faster to ship but trades flexibility for speed.
For most product teams, the right answer depends on how central analytics is to your product's core value proposition. If data is your product, build it. If data is a supporting feature, a well-integrated platform is usually the faster and smarter path.
FAQ
What is the difference between business intelligence and data visualization?
Business intelligence (BI) is the full process of collecting, modeling, and analyzing business data to support decisions. Data visualization is one output of that process, turning analytical results into charts and dashboards humans can interpret quickly. BI without visualization is hard to act on; visualization without solid BI underneath it is just pretty decoration.
Do small startups actually need BI and data visualization tools?
Yes, but proportionally. A startup with fewer than 20 people and a single product can often start with a direct database connection to a lightweight BI tool and a handful of dashboards. The key is to start simple and grow the stack as data volume and the number of decision-makers increases.
How long does it take to set up a working BI stack?
A basic setup (warehouse plus BI tool plus three to five dashboards) can be live in two to four weeks with a focused engineering effort. A production-grade stack with data modeling, access controls, and embedded analytics is typically a two to three month project, depending on the complexity of your data sources.
When should we build custom data visualization instead of using an off-the-shelf BI tool?
Build custom when analytics is a core differentiator in your product, when you need full design control for a seamless user experience, or when per-seat licensing costs would become prohibitive at scale. Use an off-the-shelf tool when speed to insight matters more than customization and your primary users are internal stakeholders.
Conclusion
The right business intelligence and data visualization setup is not about buying the most powerful tool. It's about matching your tool to your team's maturity, your data's complexity, and the specific decisions you need to make faster. Start with the questions, then build the stack around the answers.
If you're at the point where your data is growing faster than your ability to make sense of it, that's the signal to invest properly. Whether that means integrating a BI layer into your existing product or building a custom analytics experience for your customers, the payoff in clarity and speed is almost always worth it.
Take an honest look at your current stack, identify the single most important question you can't answer today, and start there.